The CDC Revision of Developmental Milestones - Here's What You Need to Know

The CDC have changed something and this time it has nothing to do with Covid19!
Here's what you need to know ...
After 15 years the Centers for Disease Control and Prevention (CDC) have updated their milestones and parent tips, and new checklists have been added for 15 and 30 months. Milestone checklists such as the Learn the Signs. Act Early. resources are designed to support early identification of developmental differences and therefore enable early provision of medical or allied health supports.
The milestones were historically devised around the concept of the average age at which a child achieves a milestone. Where 'average' meant on the 50th percentile. To understand this you may need a refresher on 'normal distribution', see the picture of a Bell Curve or Gaussian Distribution below. Unfortunately the idea of a milestone has become quite fixed in pop culture, as if it represents 'normal development' but in reality normal is a bell curve.
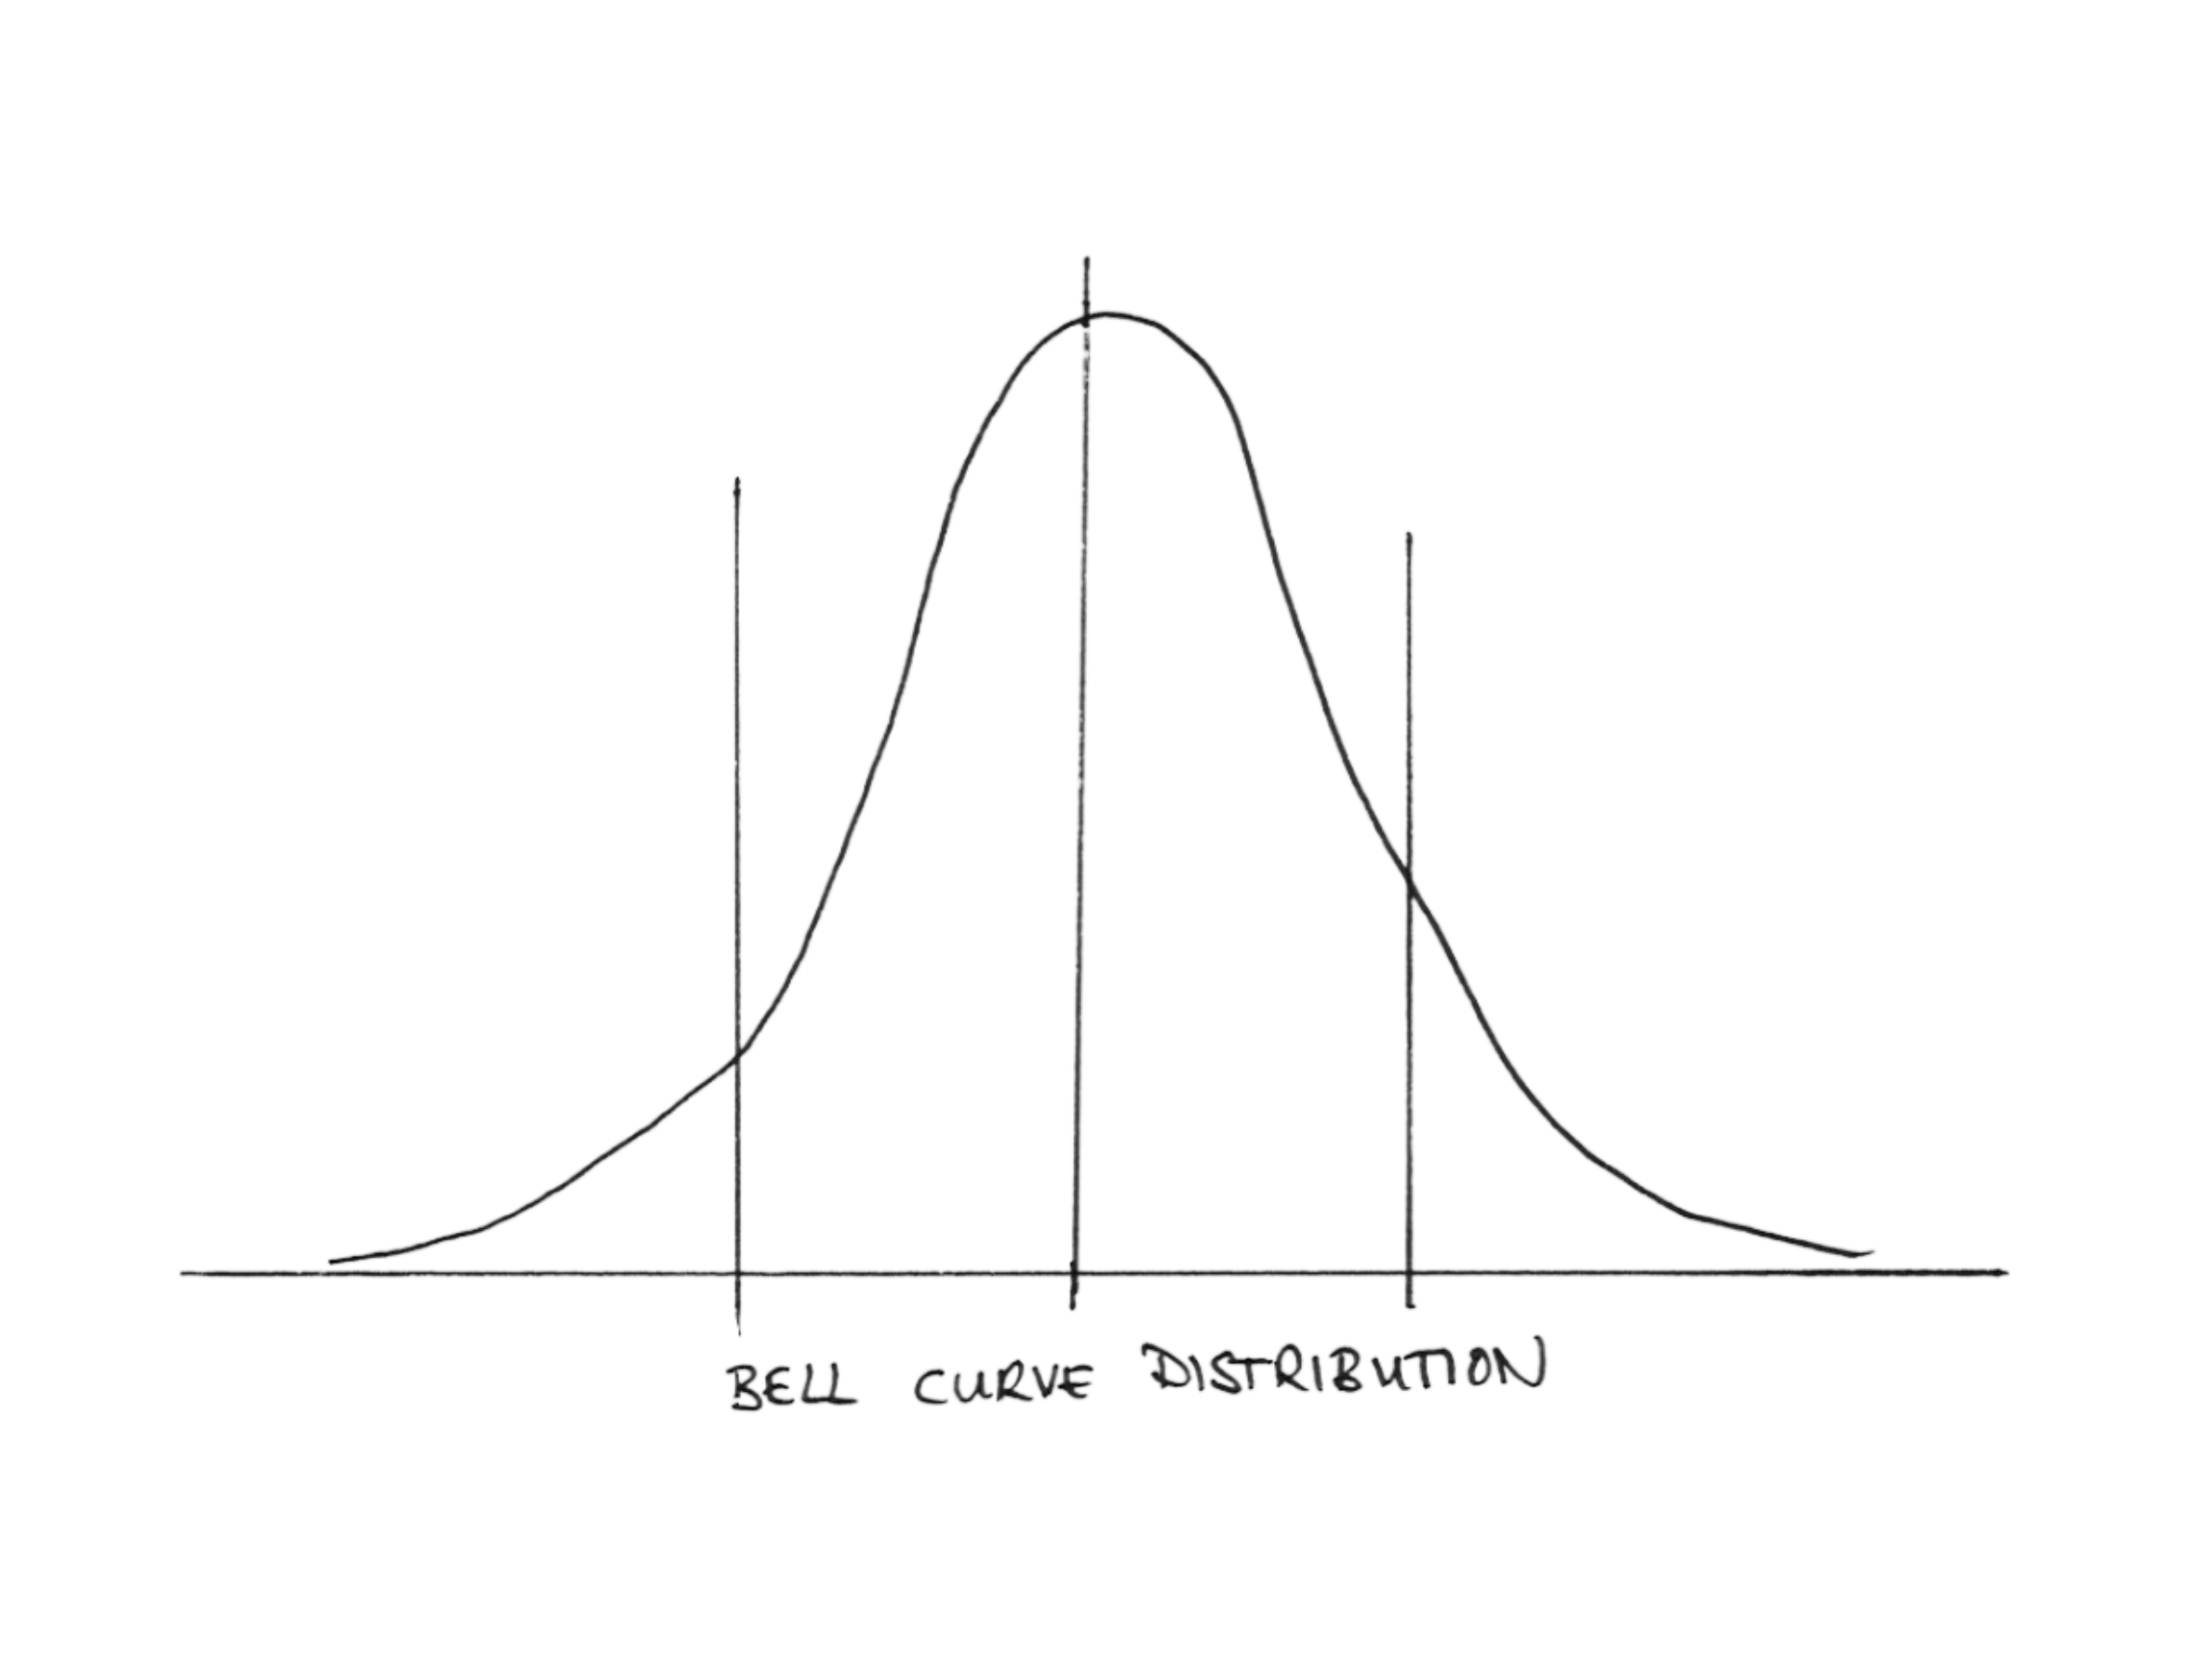
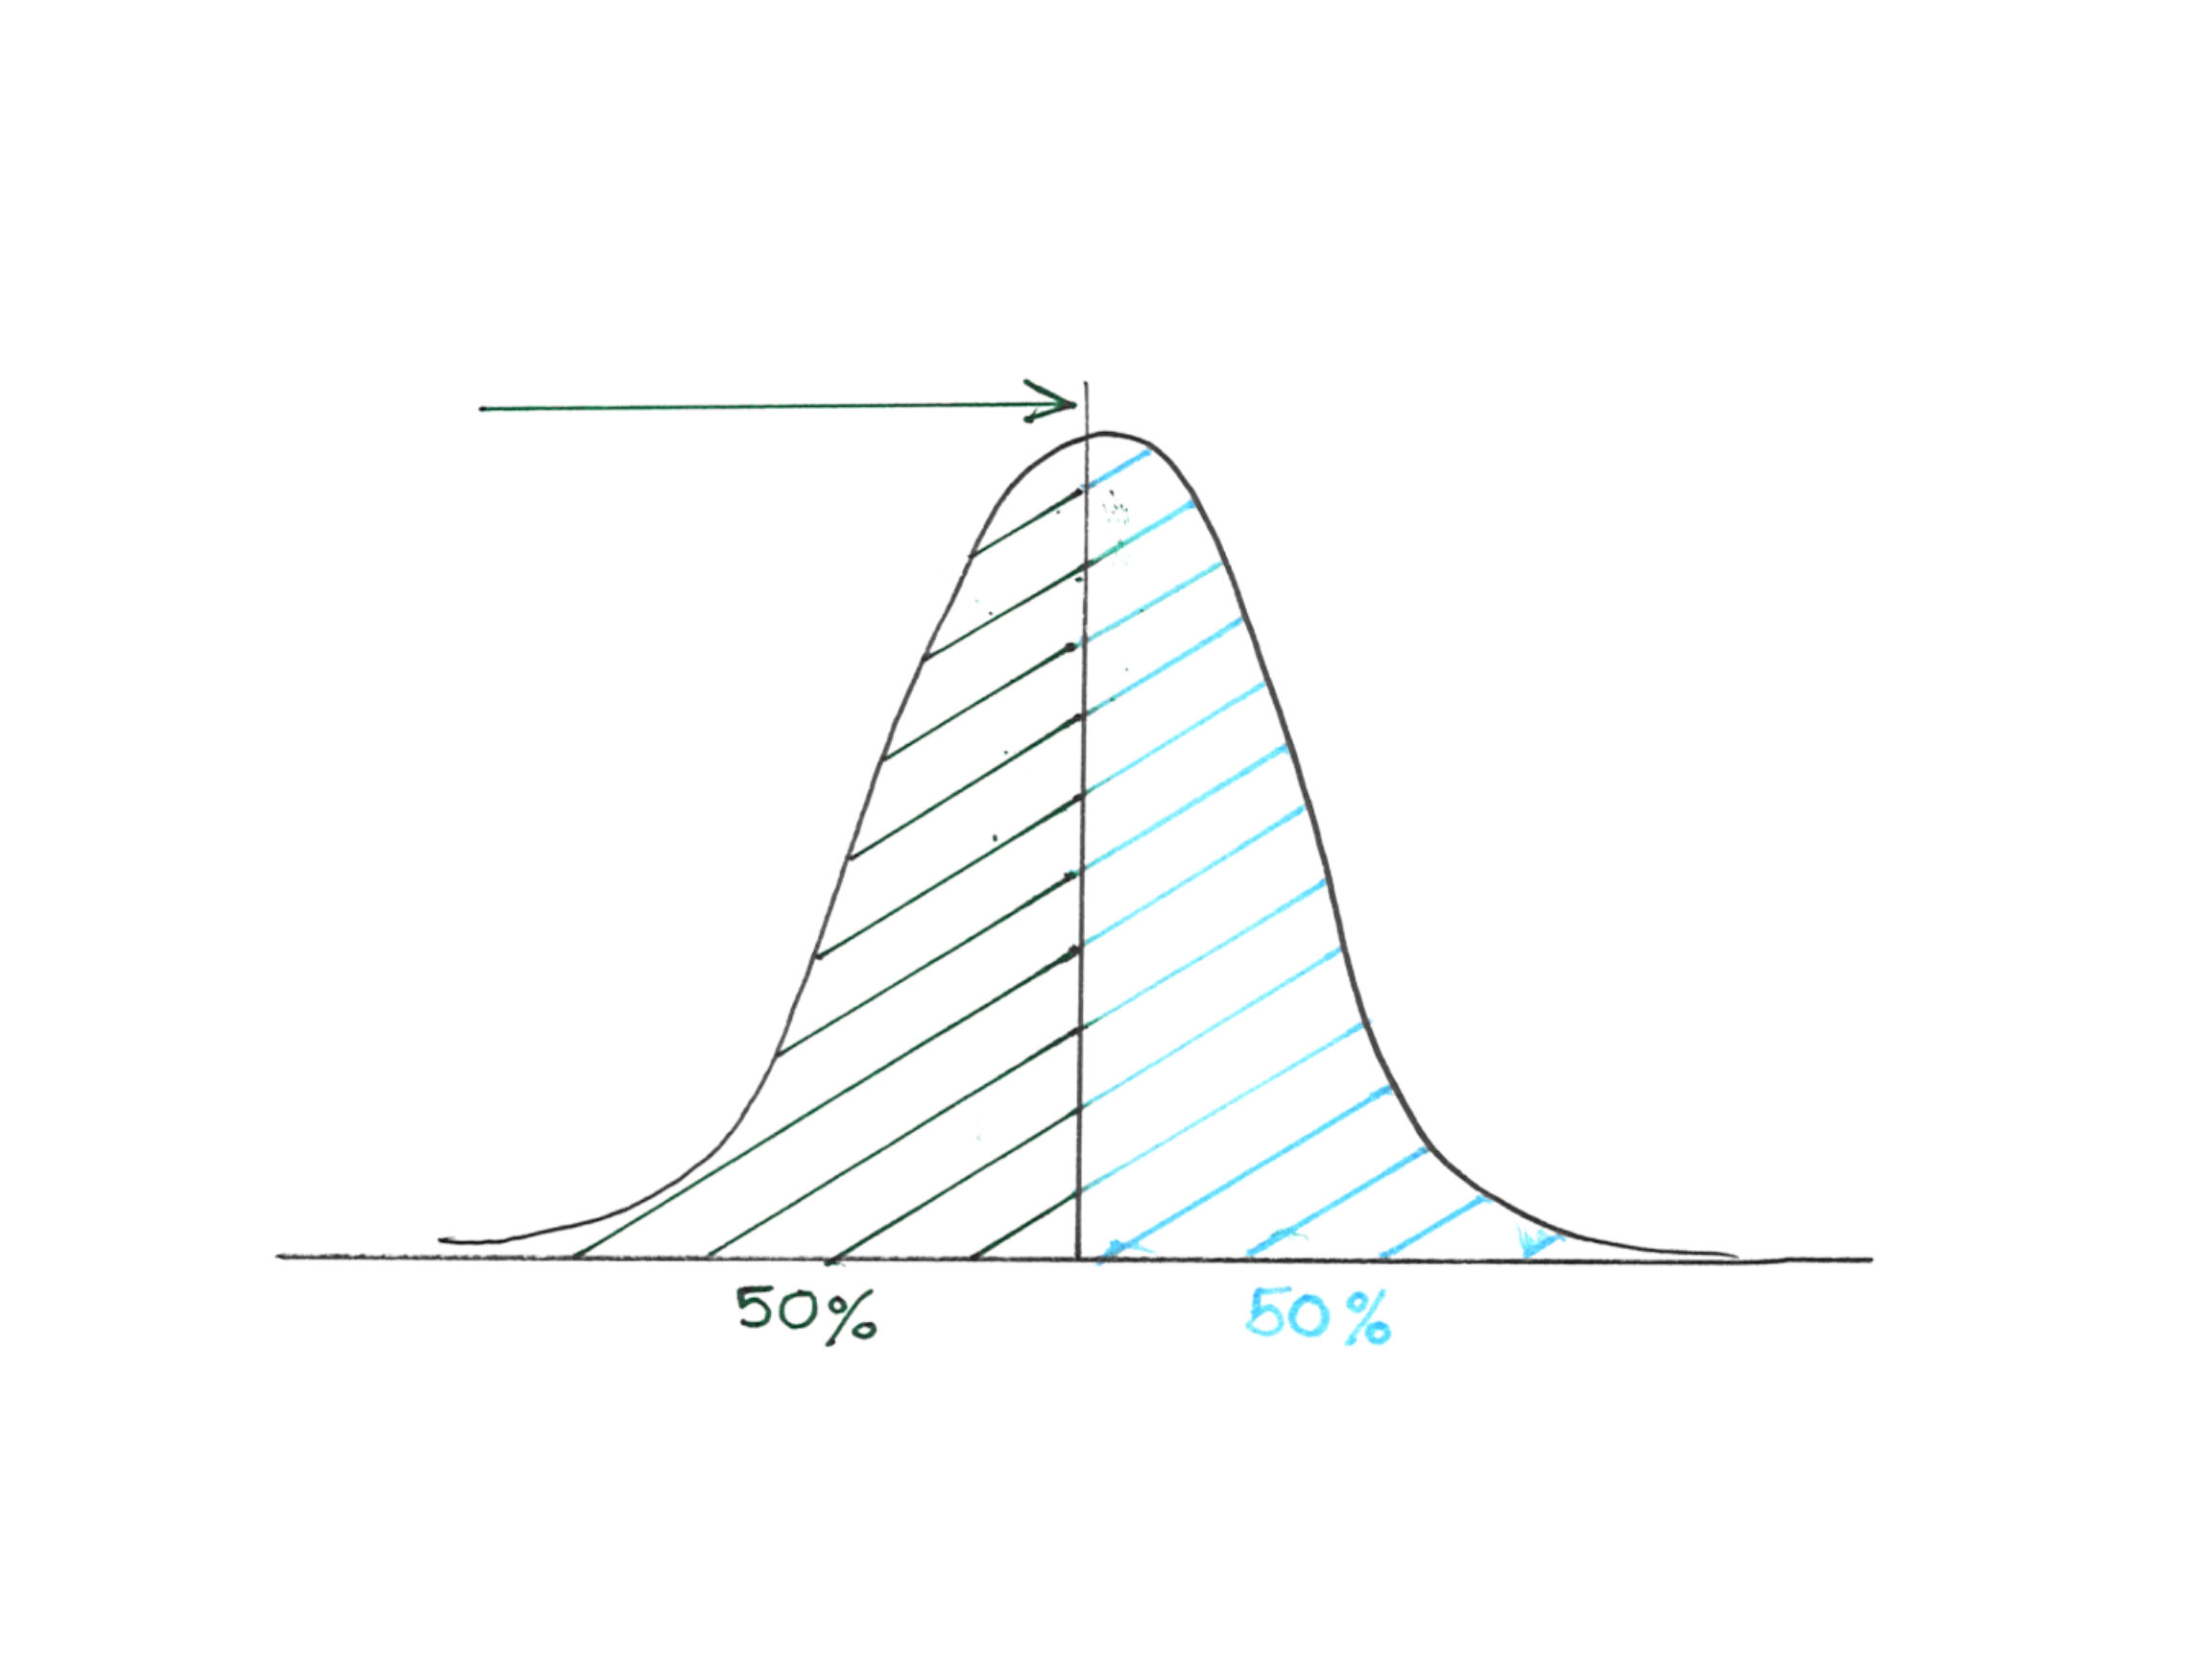
The middle of the bell curve is where the 50th percentile lies, and this is what the "average age" has been based on in the past. Take walking for example, most people know that the milestone for walking is 12 months of age. Let's look at three children and how their different milestone attainment might have impacted their families. Zane still isn't walking and he's 17 months old, the milestone charts send his Mom into a fit of panic and she remains worried about him for months after he finally masters the skill. Conversely Mile's Mom is beaming with pride because he walked at 9 months! Finally, Donny walked at 12 months, and his Mom finds herself relieved that he was allocated the label 'average' on his developmental review. Not something she ever thought she would celebrate!
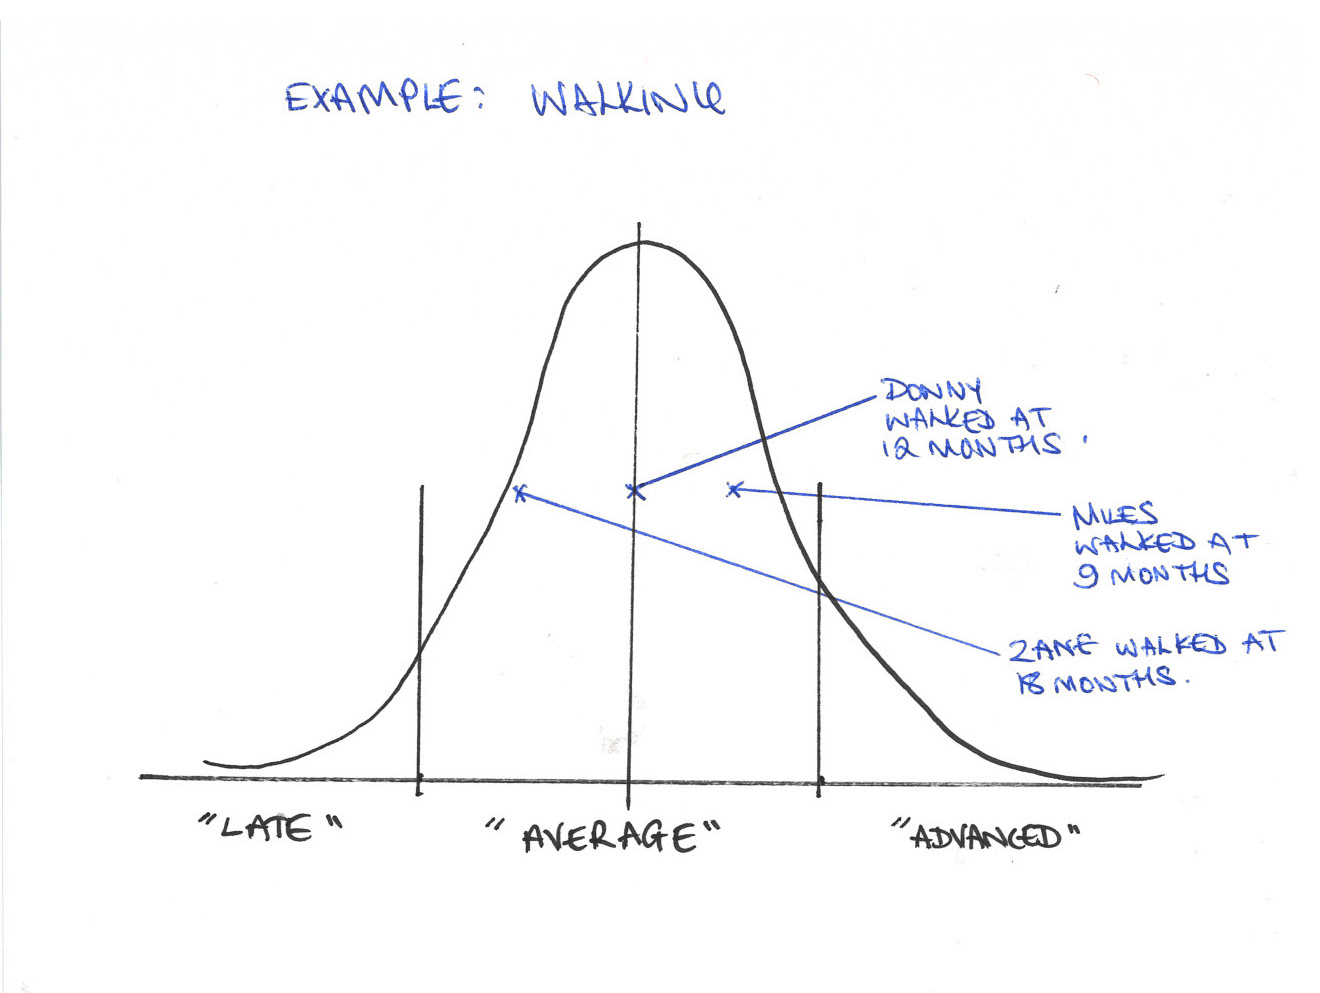
In fact, all three boys are "within normal limits" or average range. This vignette presents one of the great challenges with milestone charts. They give an odd impression of "typical development" and produce a lot of false positives when screening for potential developmental differences.
Basically, the old version of milestone charts appeared to split the population into two: those who should have achieved a milestone by now and have, and those who should have achieved a milestone but have not.
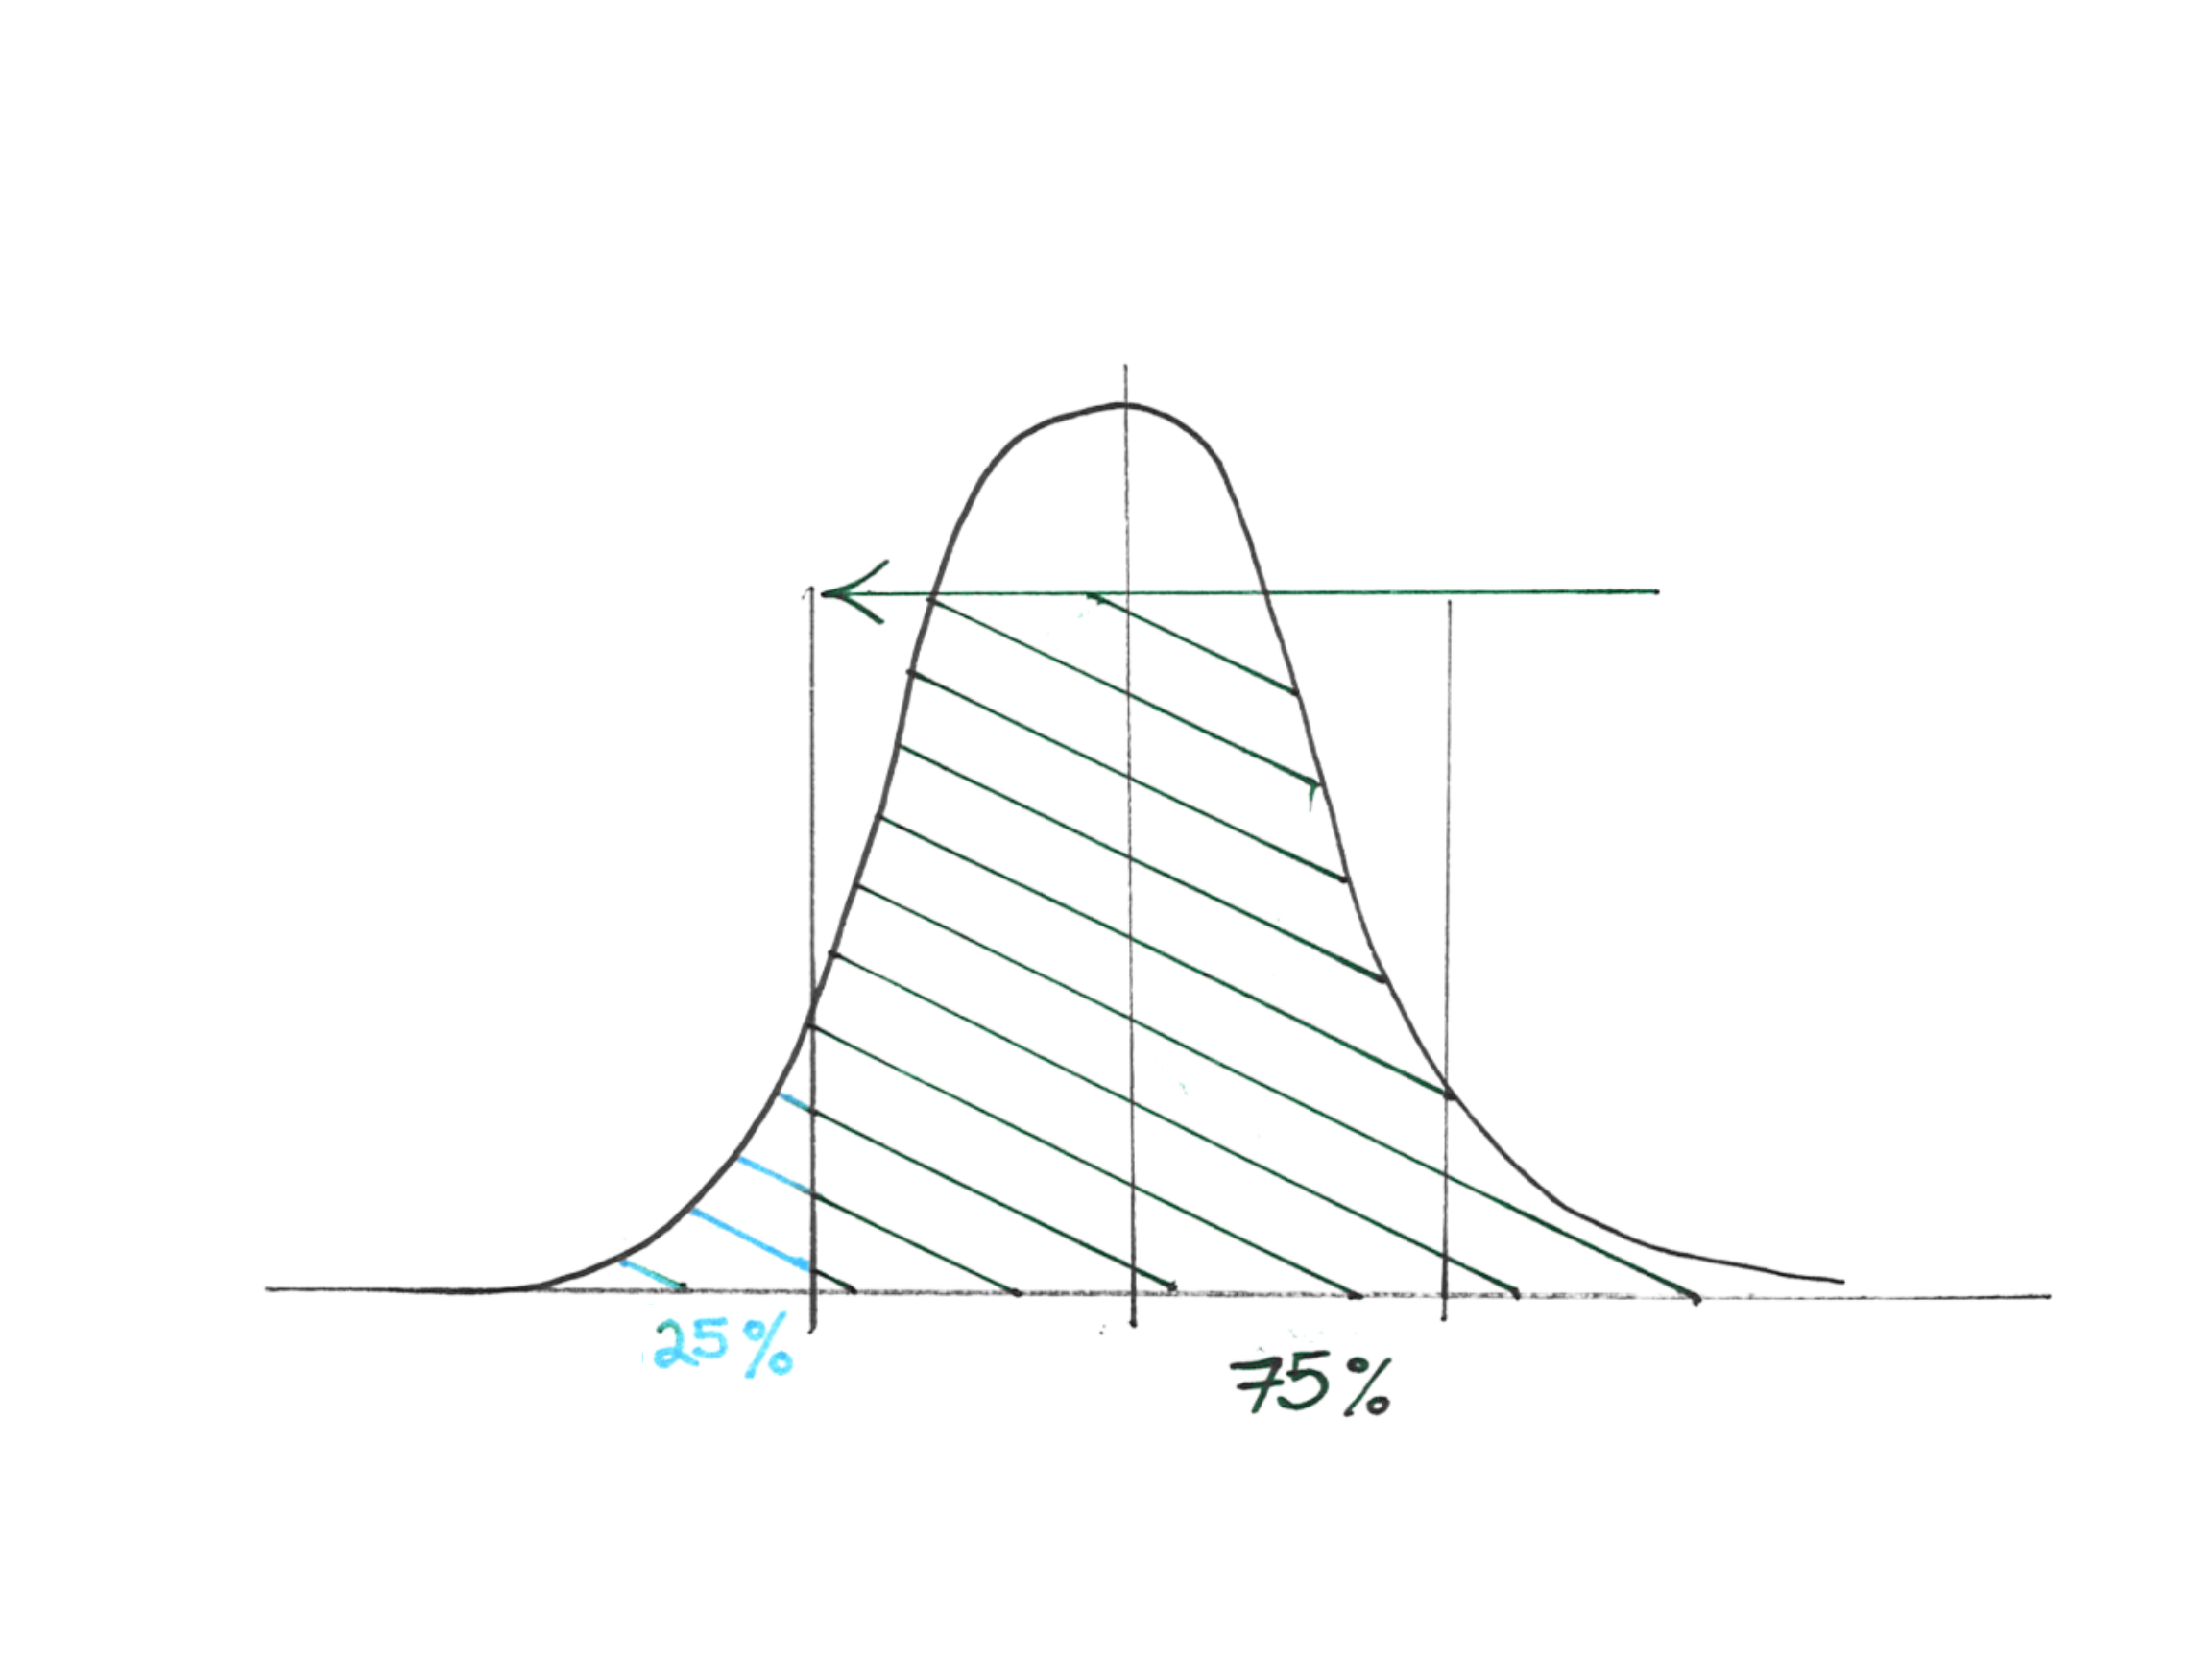
Savvy business people capitalized on this and created all sorts of expensive programs for late walkers, even if they were still "within normal limits". In truth, to be substantially off-template from the majority you need to be below the 25th percentile, or above the 75th percentile. Even then, to be in a significant (or "profound") place of need you need to be below the 5th percentile or above the 95th percentile, depending on what is being measured.
Remember: Milestones are a “snapshot” in time and should be interpreted in the context of the myriad of dynamic skills that children access in order to successfully navigate their physical and social world.
What does the update mean?
The updated CDC Learn the Signs. Act Early. resources were created with the American Academy of Pediatrics (AAP) and designed to use accessible language and provide a more accurate screening tool (or as they word it "surveillance tool"). Therefore, the updated milestones now take into account skills that research tells us 75 percent or more of children can be expected to have mastered. This means that in a room of 100 children 75 should have mastered the skill versus the 50 previous charts included. So all children who fall "within normal limits" are now included. This should eradicate many false positives when the charts are being used for developmental screening.
The process behind the revised milestones is explained in an article by Zubler et. al., titled “Evidence-Informed Milestones for Developmental Surveillance Tools” published in Pediatrics on February 08 2022.
The update also includes two additional checklists for 15 months and 30 months provided resources that align with every recommended well-child visit between the ages 2 months and 5 years. There is also a milestone tracker app that can be downloaded and uses these latest guidelines.
It is important to remember that “Learn the Signs. Act Early.” materials are not a substitute for standardized, validated, developmental screening and evaluation tools.
Other screening tools and developmental checklists can be found here: https://pathways.org/all-ages/milestones/ and here https://www.zerotothree.org/espanol/ages-and-stages
Note of Caution: Developmental milestones are broad guides. There is a lot of variation. Furthermore, milestones are designed to reflect neuromajority development. This means that they do not take into account differences in neurology etc. The importance of respecting neurodiversity at all points of the population distribution curve, cannot be emphasized enough. Development is not linear. Remember all humans do not develop according to the milestone guides - they are just guides, NOT blueprints.